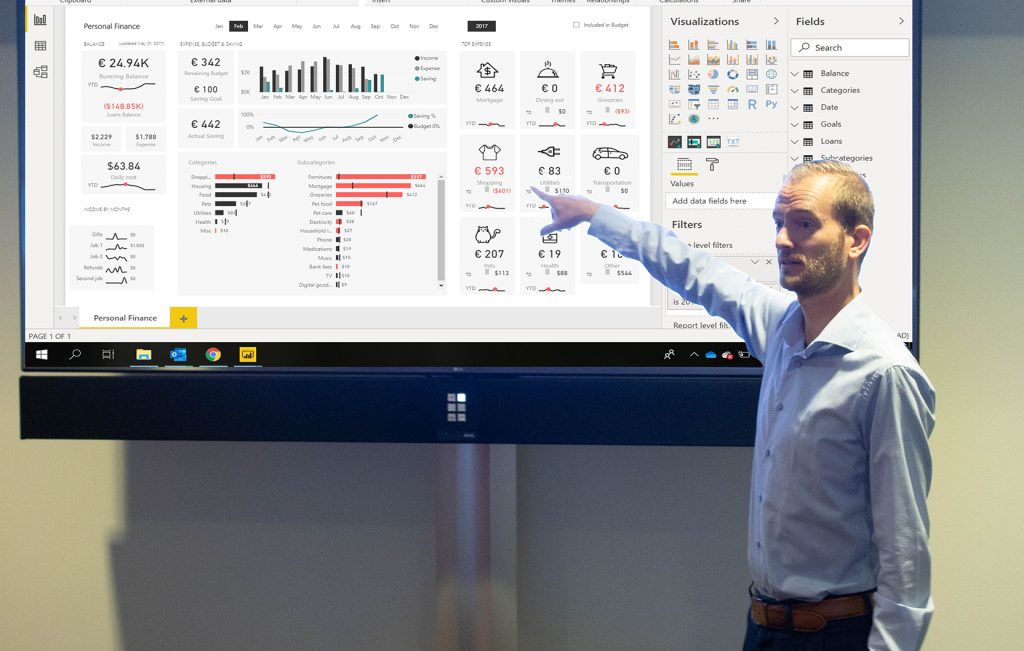
The full Agiblocks CTRM suite offers a wide variety of functionalities. When implementing the software, organizations can select what they need at that moment. Extra functions can be added at any time. But its ease of use doesn’t stop there. Thanks to the oData metadata, a machine-readable description of the data model which can be easily accessed in Agiblocks, you can enable the creation of powerful generic client proxies and tools. One of those is Power BI, the incredibly useful business analytics service by Microsoft.
Microsoft Power BI aims to provide interactive visualizations and business intelligence capabilities with an interface simple enough for end users to create their own reports and dashboards. The latter part must seem familiar to Agiblocks users, as the modular structure of our CTRM solution allows you to implement an end-to-end solution, supporting trade management as well as financial management from the same source of data and within the same easily accessible application. Power BI is the perfect partner to comprehensibly unlock the wealth of information that Agiblocks holds for you, in order to visualize your data, analyze your position and plan your next move.
We know how strong our CTRM solution is, but we’re concomitantly not afraid to point out its flaws. Or rather, to point it what you as a commodity trader and consumer can do to improve upon its everyday use. We spoke to Waldemar de Haas, Microsoft Power BI expert and Agiboo collaborator, about why Agiblocks and Power BI are such a good fit.
Power BI Knowledge
Waldemar de Haas of Power BI Knowledge is not only an expert in everything Power BI, but also one of the few Microsoft Certified Trainers we have in The Netherlands. That means he has obtained several certificates specifically for Power BI certificates, both in software and in training. The latter provides his company with access to tools, software and course materials for his training sessions, courtesy of Microsoft. He has years of experience in the field of BI solutions and working with Microsoft Power BI. It’s why we’ve asked him to come to our Almere Headquarters for a Power BI masterclass so we could buff up on our BI skills. In his comprehensive onboarding training he explains in one or two days what Power BI can do for data-driven organizations, with no prior knowledge required.

Power BI Knowledge allows you to get more out of your data and learn how to easily share information within your organization. The Power BI training courses can be followed in classes, individually or at your office. By means of clear business cases and explanations, participants are encouraged and supported to get started themselves. Which turned out to be such a success that we’ve asked him to visit some of our customers as well. De Haas flew to London for a two-day training on location, and together we hope to provide similar services for other clients as well. That is, if and when the current travel restrictions are behind us – although webinars and digital sessions are an option too.
Power BI and Agiblocks
Agiblocks is the next generation of CTRM systems. De Haas concurs. “A solution that meets all technical as well as business needs for anyone working in soft or agricultural commodities. It is rich in functionalities and supports all the flexibility that characterizes the industry, specialized for a certain commodity or commodity group.”
“However,” he notes, “it does not allow you to visualize and strategically rework your data, or at least not as well as Power BI does. Its prowess is in data management, which it does super well, and yes – there are standard reporting features, but performing analysis or calculations is not possible. That’s where Power BI comes in. It allows you to take that next step. And thanks to the Agiblocks OData feed, it’s super easy to connect.”
Plug & play
Connecting is a breeze indeed. If you wish to implement the accounting features of say MS Business Central into your Agiblocks dashboard, you need the custom connectors we’ve developed in collaboration with Vasilok. However, complementing your daily routing with the use of Power BI works the other way around: your Agiblocks data is the input, Power BI is the processor. There’s no need for connectors.
In Power BI Desktop for instance, you can connect to an OData feed and use the underlying data just like any other data source in Power BI Desktop. All you have to do to connect is to select ‘Get Data > OData Feed’ from the Home ribbon in Power BI Desktop. In the OData Feed window that appears, type or paste your OData feed URL into the box, and select OK. The URL for your particular feed can be easily obtained in your Agiblocks dashboard.
“Another advantage of entering your Agiblocks data feed into Power BI is the fact that the Microsoft tool is a generic deploy for general use.” That is to say, it’s not affiliated with a particular industry, or a specific commodity, as opposed to Agiboo’s CTRM solution.
“It can be used by Finance and Business controllers, but also in HR to delineate sick leave, or in Marketing for the purposes of SEO analysis – to name just a few practical applications. In the end, it’s used in any data-driven organization that for all intents and purposes can no longer rely on Excel. Complex and rapidly changing data streams demand a tool that is specifically designed for that purpose – like Power BI is.”
Visualization is key
We’ve seen that analogy before. When Agroforce selected Agiblocks to take their CTRM efforts to the next level, Excel had run its course too. “It was manageable, but it got to be rather time-consuming as it grew into a bit of a monster” managing director Erik van der Flier said. “Editing all those separate files, ever-expanding and growing more intricate, requires a lot of manual modifications.” The company decided Agiblocks was the proper solutions for that and other problems – and rightfully so. This time around, it’s Agiblocks that has reached the limits of its serviceability – but only in terms of what Power BI can bring as a complement: an approachable and custom-made visualization of your data.

Data is the new gold, but only if you can mine it. “Is the valuable data your company holds cluttered and inaccessible? Microsoft Power BI can help you to bring all this locked data together, interpret it, and share it with your management team and coworkers through customized visualizations.” The latter has become increasingly important amidst the current pandemic, as joint corporate sessions and team meetings can be quite challenging on the logistic level right now. Moreover, there is a cry for clear, accessible and shareable representation of data in the workplace like never before. “Deploying Power BI, the industry leader in interactive visualizations, is an obvious next step for Agiblocks customers. It helps you to gain new insights into your data streams, so you can respond to market developments, improve your work processes and make new predictions.”
Do you want to know more?
Power BI allows you to combine different types of data to display management information in a visual dashboard. It’s available as Software as a Service (SaaS) and as part of the Microsoft 365. Do you want to know more about the advantages of plugging your Agiblocks feed into Microsoft Power BI, or would you like you to enquire how Power BI Knowledge and Waldemar de Haas can support your company in that process? Please contact us by calling our office at +31 (0) 36 52 13131, or by e-mail to info@agiboo.com.

