Agiblocks is a one-stop CTRM software solution designed by trade professionals, for trade professionals. To simply and streamline your fixed routine, it focuses on all the aspects of the daily practices of the trade. That means we focus on risk management too, with some great tools for markets analysis – such as our latest features for OTC contracts and What-If analysis. In this article, we’d like to take a closer look at VaR (or Value at Risk, not to be confused with Video Assisted Referee, a totally different type of risk management) and how you can use the Agiblocks module on VaR as an insightful risk assessment tool.
Value at Risk: a definition
Value at Risk is a clear and comprehensible measure of the estimated risk of loss for any investment – ‘clear’ meaning fairly easy to use, and ‘estimated’ meaning there are no guarantees. In economics and finance, as well as in life, things are never one hundred percent certain, nor do the most certain outcomes yield the best results.
Anyway, Value at Risk or VaR provides an estimation (or probability) of the size of the loss for an investment, given variables like asset size, market conditions and time constraints. For an investor, it’s all about probabilities, as the main focus of risk management is usually: ‘what are the odds of losing money?’. VaR is focused on that very presumption. It is typically used to estimate the amount of assets needed to cover potential losses. | For more on hedging, refer to our previous article: Hedging 101 – hedging with agricultural options
Calculating VaR
Value at risk (VaR) is a popular method for risk measurement. The indication of the level of risk you take with a certain investment can help you decide whether the possible gain is worth the potential maximum loss. VaR can be calculated for either one asset, a portfolio of multiple assets of an entire firm.
By calculating VaR the following question can be answered:
‘What can I, with a certain level of confidence, expect to lose in monetary or percentage terms, during a given period of time?’
A VaR calculation consequently consists of three elements: a confidence level, a time period and the expected maximum loss. This could result in an answer resembling the following:‘With 90 percent confidence, I expect my worst daily loss not to exceed 3.5 percent’
Level of confidence
The first element is the level of confidence. This element represents the chance a certain risk may occur. Using the answer mentioned above, there is a 90 percent chance the worst daily loss will not exceed 3.5 percent. This element represents whether it is likely the maximum loss can be made and thus whether it is worth taking the risk.
Time constraints
The second element is the time constraint, the given horizon of the investment in terms of maturity. In other words, it represents the time period over which the loss can be realized. This can be expressed in daily, monthly or even yearly periods. This element is a factor for determining whether an investment represents a short- or long-term risk.
Expected maximum loss
The third element is the expected maximum loss. This is a crucial one, because it indicates what the worst-case scenario would be, should the risk become reality. This element must be considered before making an investment, to determine what this maximum loss may do to a trading account. Furthermore, it can aid in making the decision whether the loss is acceptable considering the potential profit made on the investment.
There are three different methods for calculating VaR where each method has different strengths and weaknesses. Agiblocks provides an integrated Value at Risk (VaR) module, which can calculate your value at risk based on your entire portfolio or a selection of your portfolio. The information generated by this module can prove critical in your risk management activities and help you make decisions concerning your risk exposure.
For more information on the VaR module of Agiblocks, please contact us directly or request a demo to take full advantage of all Agiblocks has to offer, without any obligation. For now, let’s look at the various methods of calculating VaR.
Historical method of calculating VaR
The historical method makes use of known historical data to calculate the VaR. The data is used to identify the returns on a specific commodity or index. These daily, monthly or even yearly returns are collected into a graph, providing insight into the historical return and frequency of the different returns. The higher frequency of a return the more likely it is a return will re-occur in the future.
For example: if a negative return of 5 percent represents only 3 percent of the total of reruns, there is a change of 97 percent a daily loss will not exceed 5 percent.
This is a relatively easy method for calculating VaR, which gives it an edge over other methods. That’s especially true for fairly stable markets, where history tends to repeat itself. The weakness of using historical data is that it does not takes changing market conditions into consideration. This may cause the calculation to be out of sync with actual market developments.
Variance-Covariance method of calculating VaR
The variance-covariance method is based on a normal distribution of returns. This requires estimating the expected (or average) returns and standard deviation. These two factors can be combined to create a normal distribution curve.
Similar to the historical method, the variance-covariance method calculates the probability of a return occurring and creates a normal distribution graph based on this data.
The advantage of using a normal distribution curve is that it gives a clear overview of the most likely return on an asset. It is the easiest method for calculating VaR. Whereas the other methods require far more historical data and calculations, the variance-covariance method requires only the expected average return and its standard deviation. This will also limit the work hours invested in calculating the VaR. With the normal distribution curve formed it is fairly easy to say the probability of a certain return occurring.
The danger of using the variance-covariance method and consequently the normal distribution curve, is that the normal distribution may not be realistic. Off-market factors can increase price volatility, which results in the normal distribution curve being out of sync with actual market movement.
Monte Carlo Simulation for calculating VaR
The Monte Carlo Method uses simulations to calculate the VaR. A risk manager will perform a number of simulations, with each simulation using different input variables. These variables may range from level of volatility, initial price, correlation estimates, and so on. All simulations will generate different outcomes which appear in a similar fashion to those of the other methods; a graph which shows the number each return is realized.
The advantage of using the Monte Carlo Method is that it will likely be more realistic compared to the other two methods. It also gives a risk manager the possibility to adjust his simulation to current market developments. This way his simulations can be more in sync with current market movements. It also gives the risk manager the opportunity to let his personal judgment be a factor for determining the probability at which a return may occur.
The Monte Carlo method however requires a lot of time and work to successfully be used in risk assessment. Moreover, with the number of factors influencing the returns, the number and complexity of the simulations must increase in order to simulate as many possible outcomes to get a reasonable estimate of the returns.
VaR in Agiblocks
Agiblocks provides an integrated Value at Risk (VaR) engine, which can calculate your value at risk based on your entire portfolio or a selection of your portfolio. The information generated by this module can prove critical in your risk management activities and help you make decisions concerning your risk exposure. Contact us for more information on the VaR module of Agiblocks. Or better yet: request a free demo of our Agiblocks CTRM Solution.
But wait, there’s more! Our VaR Engine is fully equipped to handle all the information you have within Agiblocks, but there are ways to gather even more input. If you want to go even deeper, there’s some good news; we’ve entered into a partnership with Tradesparent to take Commodity Management to the next level.
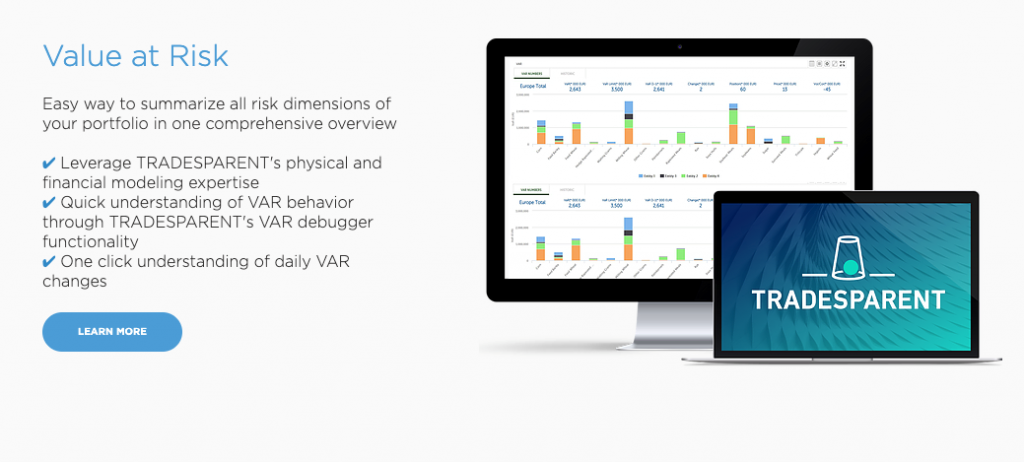
Tradesparent is a Software and Data Engineering company that provides a completely unique data consolidation and service platform for risk and performance management, planning and analytical processes. Through its exposure modeling capabilities with sophisticated risk metrics it enables prediction of performance volatility under complex market conditions. Tradesparent offers real-time VaR, stress testing to limit structure and option analytics to go the extra mile in risk management.
Furthermore, data ingestion and normalization are their core strengths, thanks to an intuitive and well-equipped data hub that allows for the easy integration of any other data solution you might use. It offers a very easy way to summarize all risk dimensions of your portfolio in one comprehensive overview as well as provides a quick understanding of VaR behavior through its innovative VaR debugger functionality. A complete and uncluttered overview of your daily VaR changes is just one click away!
Find out more about Tradesparent and VaR on their website!